Sample Size and
Confidence Intervals
Explainer and calculators
If you already understand these concepts, you can skip straight to the tools.

Understanding Sample Size and Confidence Intervals
Before using any calculator, it’s important to understand the two central ideas that govern survey accuracy: confidence interval and confidence level.
Confidence Interval (Margin of Error)
The confidence interval—often called the margin of error—represents how much your results may vary from the true population value.
If a survey finds that 47% of respondents prefer a product, with a ±4% confidence interval, the true value in the population is likely between:
- 43% and 51%
This does not mean the result is wrong—it means the estimate has a known range of uncertainty.
Confidence Level
The confidence level tells you how sure you are that the true value lies within that interval.
- 95% confidence level → you are correct 95 times out of 100
- 99% confidence level → you are correct 99 times out of 100
Nearly all polling and most social research uses 95%, as it balances reliability with practicality, using fewer data points, which is often a major consideration.
When combined, these concepts mean that you to say:
“We are 95% confident that the true value lies within this margin of error.”
What Determines Accuracy?
Three main factors influence the size of your confidence interval:
1. Sample Size
The most important factor is how many people you survey.
- Larger samples → more precise results (smaller margin of error)
- Smaller samples → less precision
However, the relationship is not linear. Doubling your sample size does not cut the error in half—it reduces it more gradually.
2. Percentage (Response Distribution)
Accuracy also depends on how responses are distributed.
- Extreme results (e.g., 99% vs 1%) → more certainty
- Close splits (e.g., 51% vs 49%) → less certainty
For planning purposes, researchers use 50% as the “worst-case scenario,” since it produces the largest possible margin of error.
3. Population Size
Surprisingly, population size matters far less than most people expect.
- For large populations, it has almost no impact
- A sample of 500 can represent:
- a city of 100,000
- or a country of millions
Population size only becomes relevant when studying small, well-defined groups (e.g., members of an organization).
A Critical Assumption: Random Sampling
All of these calculations depend on one key assumption:
The sample must be random and representative.
If your sample is biased—intentionally or unintentionally—the results cannot be trusted, regardless of sample size.
Examples of bias:
- Surveying only during working hours
- Using opt-in online polls
- Reaching only a specific subgroup
A flawed sampling technique leads to misleading conclusions, even if the math is correct.
Here are some flawed techniques to avoid:
Convenience Sampling : Don’t just survey your coworkers because it’s convenient, or customers from a single store in a national chain. Such results often exhibit flaws based on the socio-demographic composition of the local sample.
Location bias : Similar to Convenience sampling above, sampling for a limited geographical area may produce biased results. A survey on consumer behaviour will provide biased results if the only sampling location is a high-end shopping mall.
Voluntary response : If people choose whether to participate then you are more likely to receive extreme opinions which will often skew results. Online polls are particularly guilty of this, and often are of little use when compared to properly conducted polls.
Non-response bias : Similar to Voluntary response above, if non-respondents are grouped into homogeneous groups, it’s just as problematic. For example a poll sent to elderly constituents, but requires logging on to the Internet to record responses, or conversely a mail-in poll to young constituents that require handwriting comments and mailing in responses. In this case the poll will over-represent the respondents, and under-represent those who chose not to respond.
Undercoverage bias : Some segments of the population are not included. When an entire group of people are systematically excluded, the sample will provide incomplete results. For example sending the poll by text message excludes landline users. Emailed surveys exclude people without internet access. If your goal is to poll the entire population, many methods must be used to reach every possible socio-demographic group.
Time-based sampling bias : Telemarketing companies know that calls are more likely to be answered in the late afternoon and early evening, but this method skews responses away from the segment of the population working shifts or non-standard hours. Care must be taken that multiple attempts be made to reach the identified sample respondents at different times of the day.
Framed sampling : Recruiting participants from a group already aligned with a topic. If you ask members of a fitness group about health habits you will receive very different results than a group about fine dining. Take care not to align the interests of the survey group too closely to the subject of the survey
Snowball sampling : When participants are asked to recruit others they know by sharing the survey with their friends, you are also in danger of creating a bias. People often know people that are similar to themselves, socially and demographically, which creates clusters of similar respondents. If respondents can share the survey, you must control the outcome through other means, such as using a geographic clustering method to calculate over-representation.
Survivor bias : Surveying only graduates of a school creates a bias by ignoring everyone who dropped out. Similarily surveys that focus on current customers can ignore those past customers who churned out of the current population.
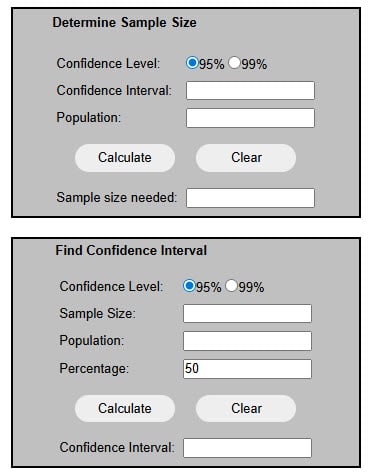
Calculators
Determine sample size
Confidence level
Find confidence interval
Confidence level
A Quiet Cornerstone of Survey Science
Creative Research Systems and the Survey System Calculator
For many years, the sample size and confidence interval calculators hosted by Creative Research Systems on SurveySystem.com served as a quiet but indispensable tool for researchers, analysts, students, and curious minds alike.
At a time when statistical software was often complex, expensive, or inaccessible, this simple web page offered some simple clarity by distillin essential statistical concepts into a simple that anyone can use:
- How many people do I need to survey?
- How reliable are my results?
Without fanfare, paywalls, or unnecessary complexity, it provided a form of public service that helped democratize quantitative thinking.
As the web evolves and older resources fall into disrepair, it is worth recognizing the enduring value of tools like this one. They didn’t just perform calculations—they taught foundational principles grounded in real-world applications.
This page is both a tribute and a continuation: preserving not only the functionality, but the understanding behind it.